RANSAC
Usage
RANSAC stands for RANdom SAmple Consensus. This algorithm can build a model that describes the data set or find outliers in this data set. Let’s have a look at how it works.
Imagine we are looking for a new apartment, and we collected some data from the website. Typically, this data will have a linear dependency between the price and the area.
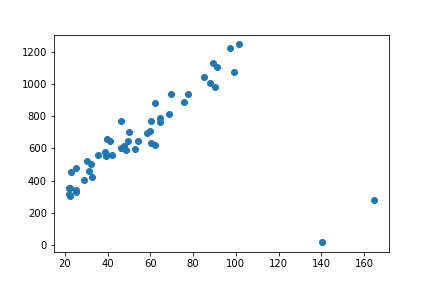
If you ever used such a website, you know that sometimes ads have typos in the price field or have some strange values like 1$ or 0, etc. These points are known as outliers, and we would like to filter them out from our set. There is when RANSAC came into play.
Idea
The idea of this algorithm is extremely easy and straightforward:
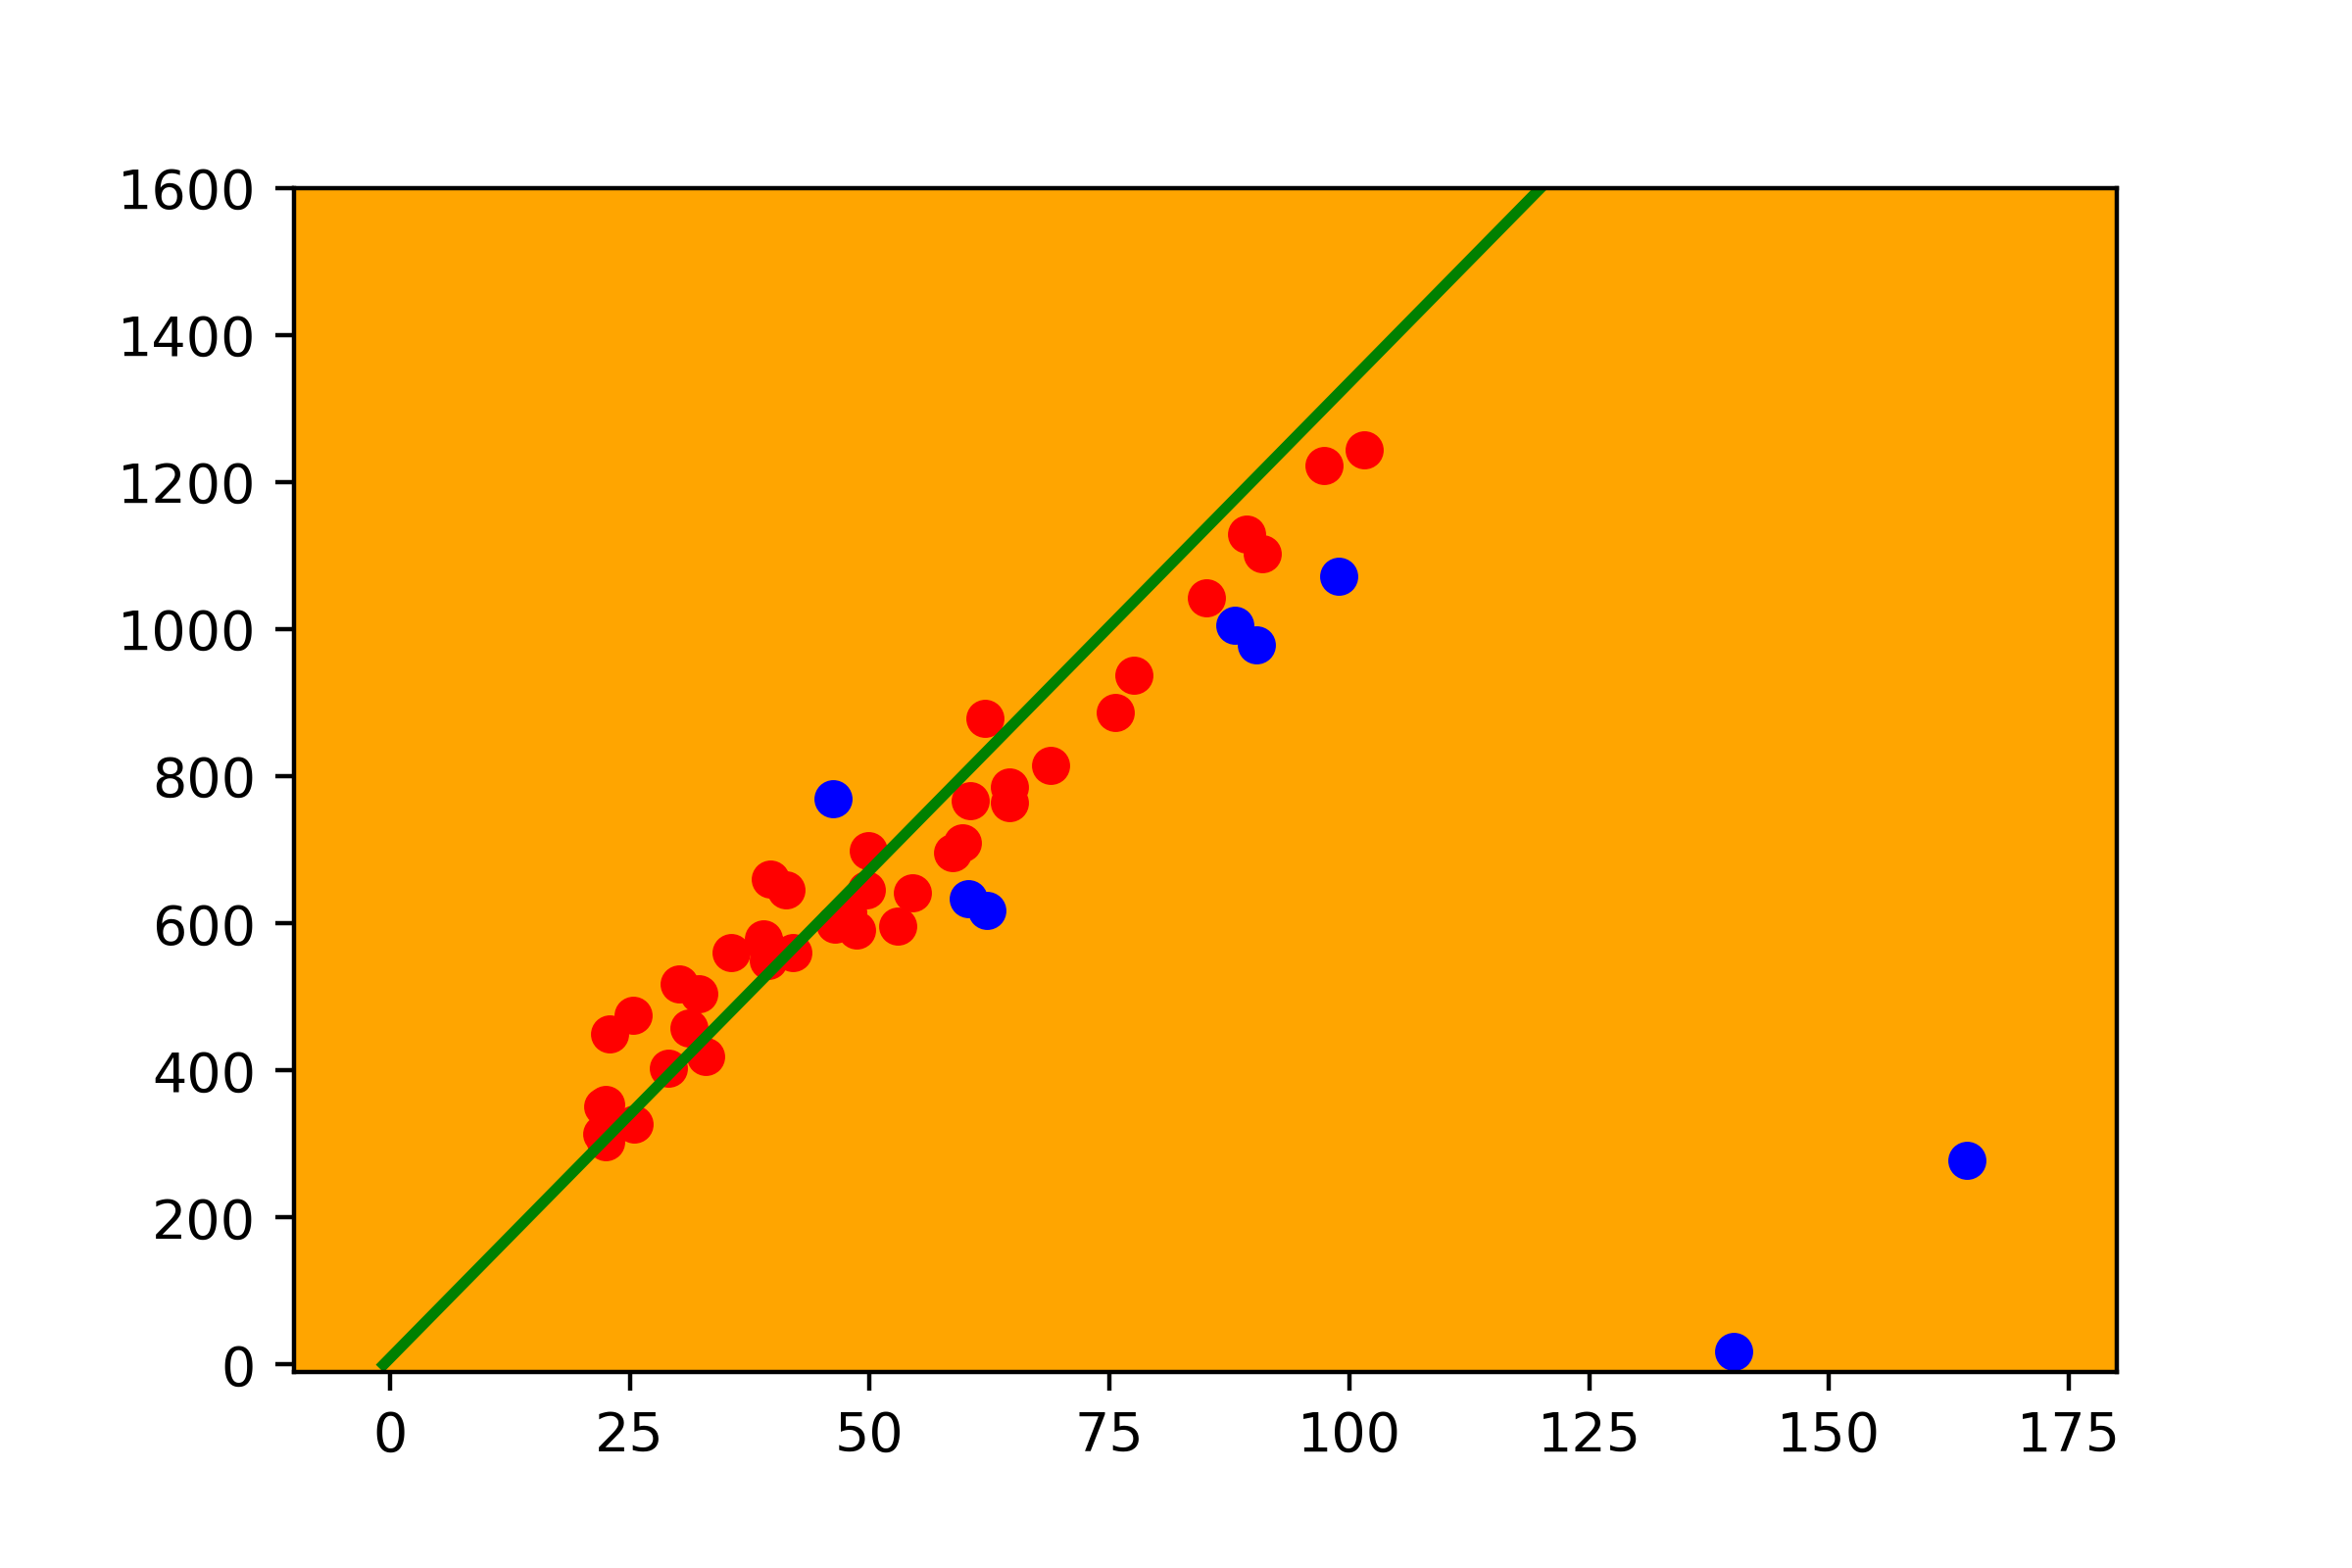
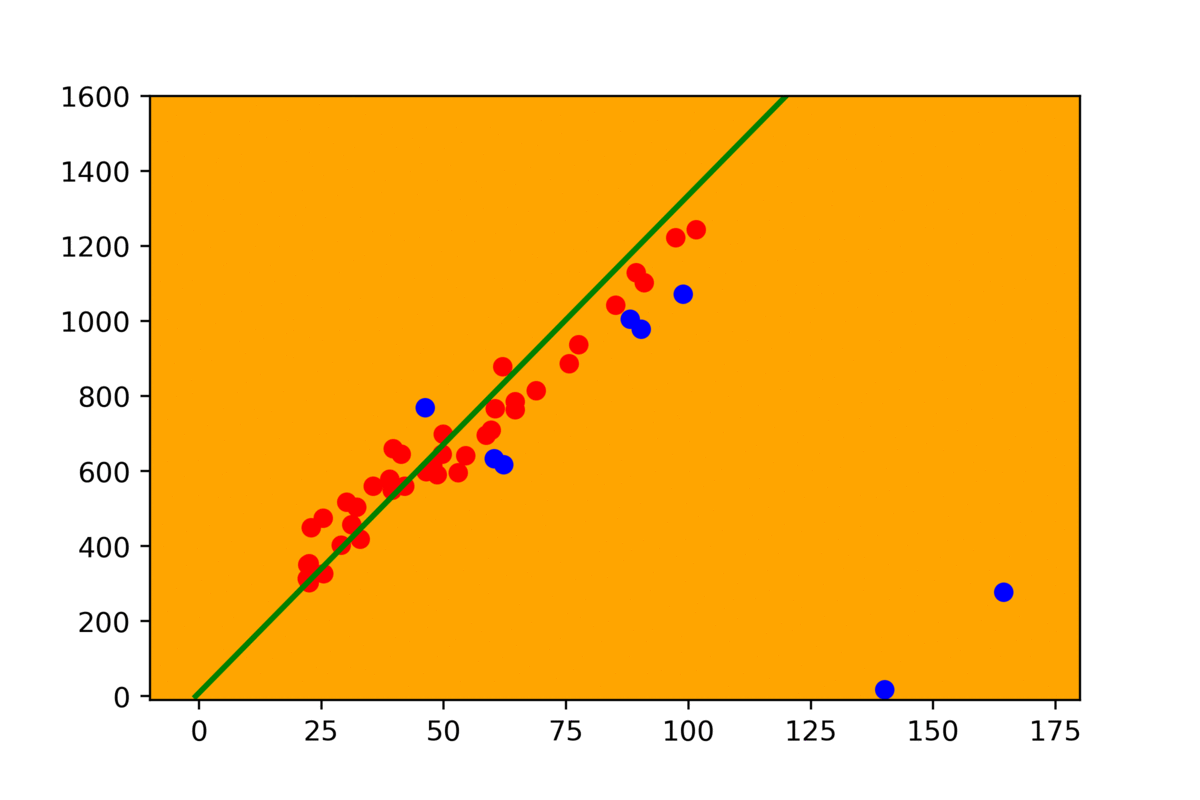
- We have to pick two random points from our set and connect them with a line.
- Then count all the points close enough to our line and store them in the list. Potentially they are our inliers. The rest are outliers.
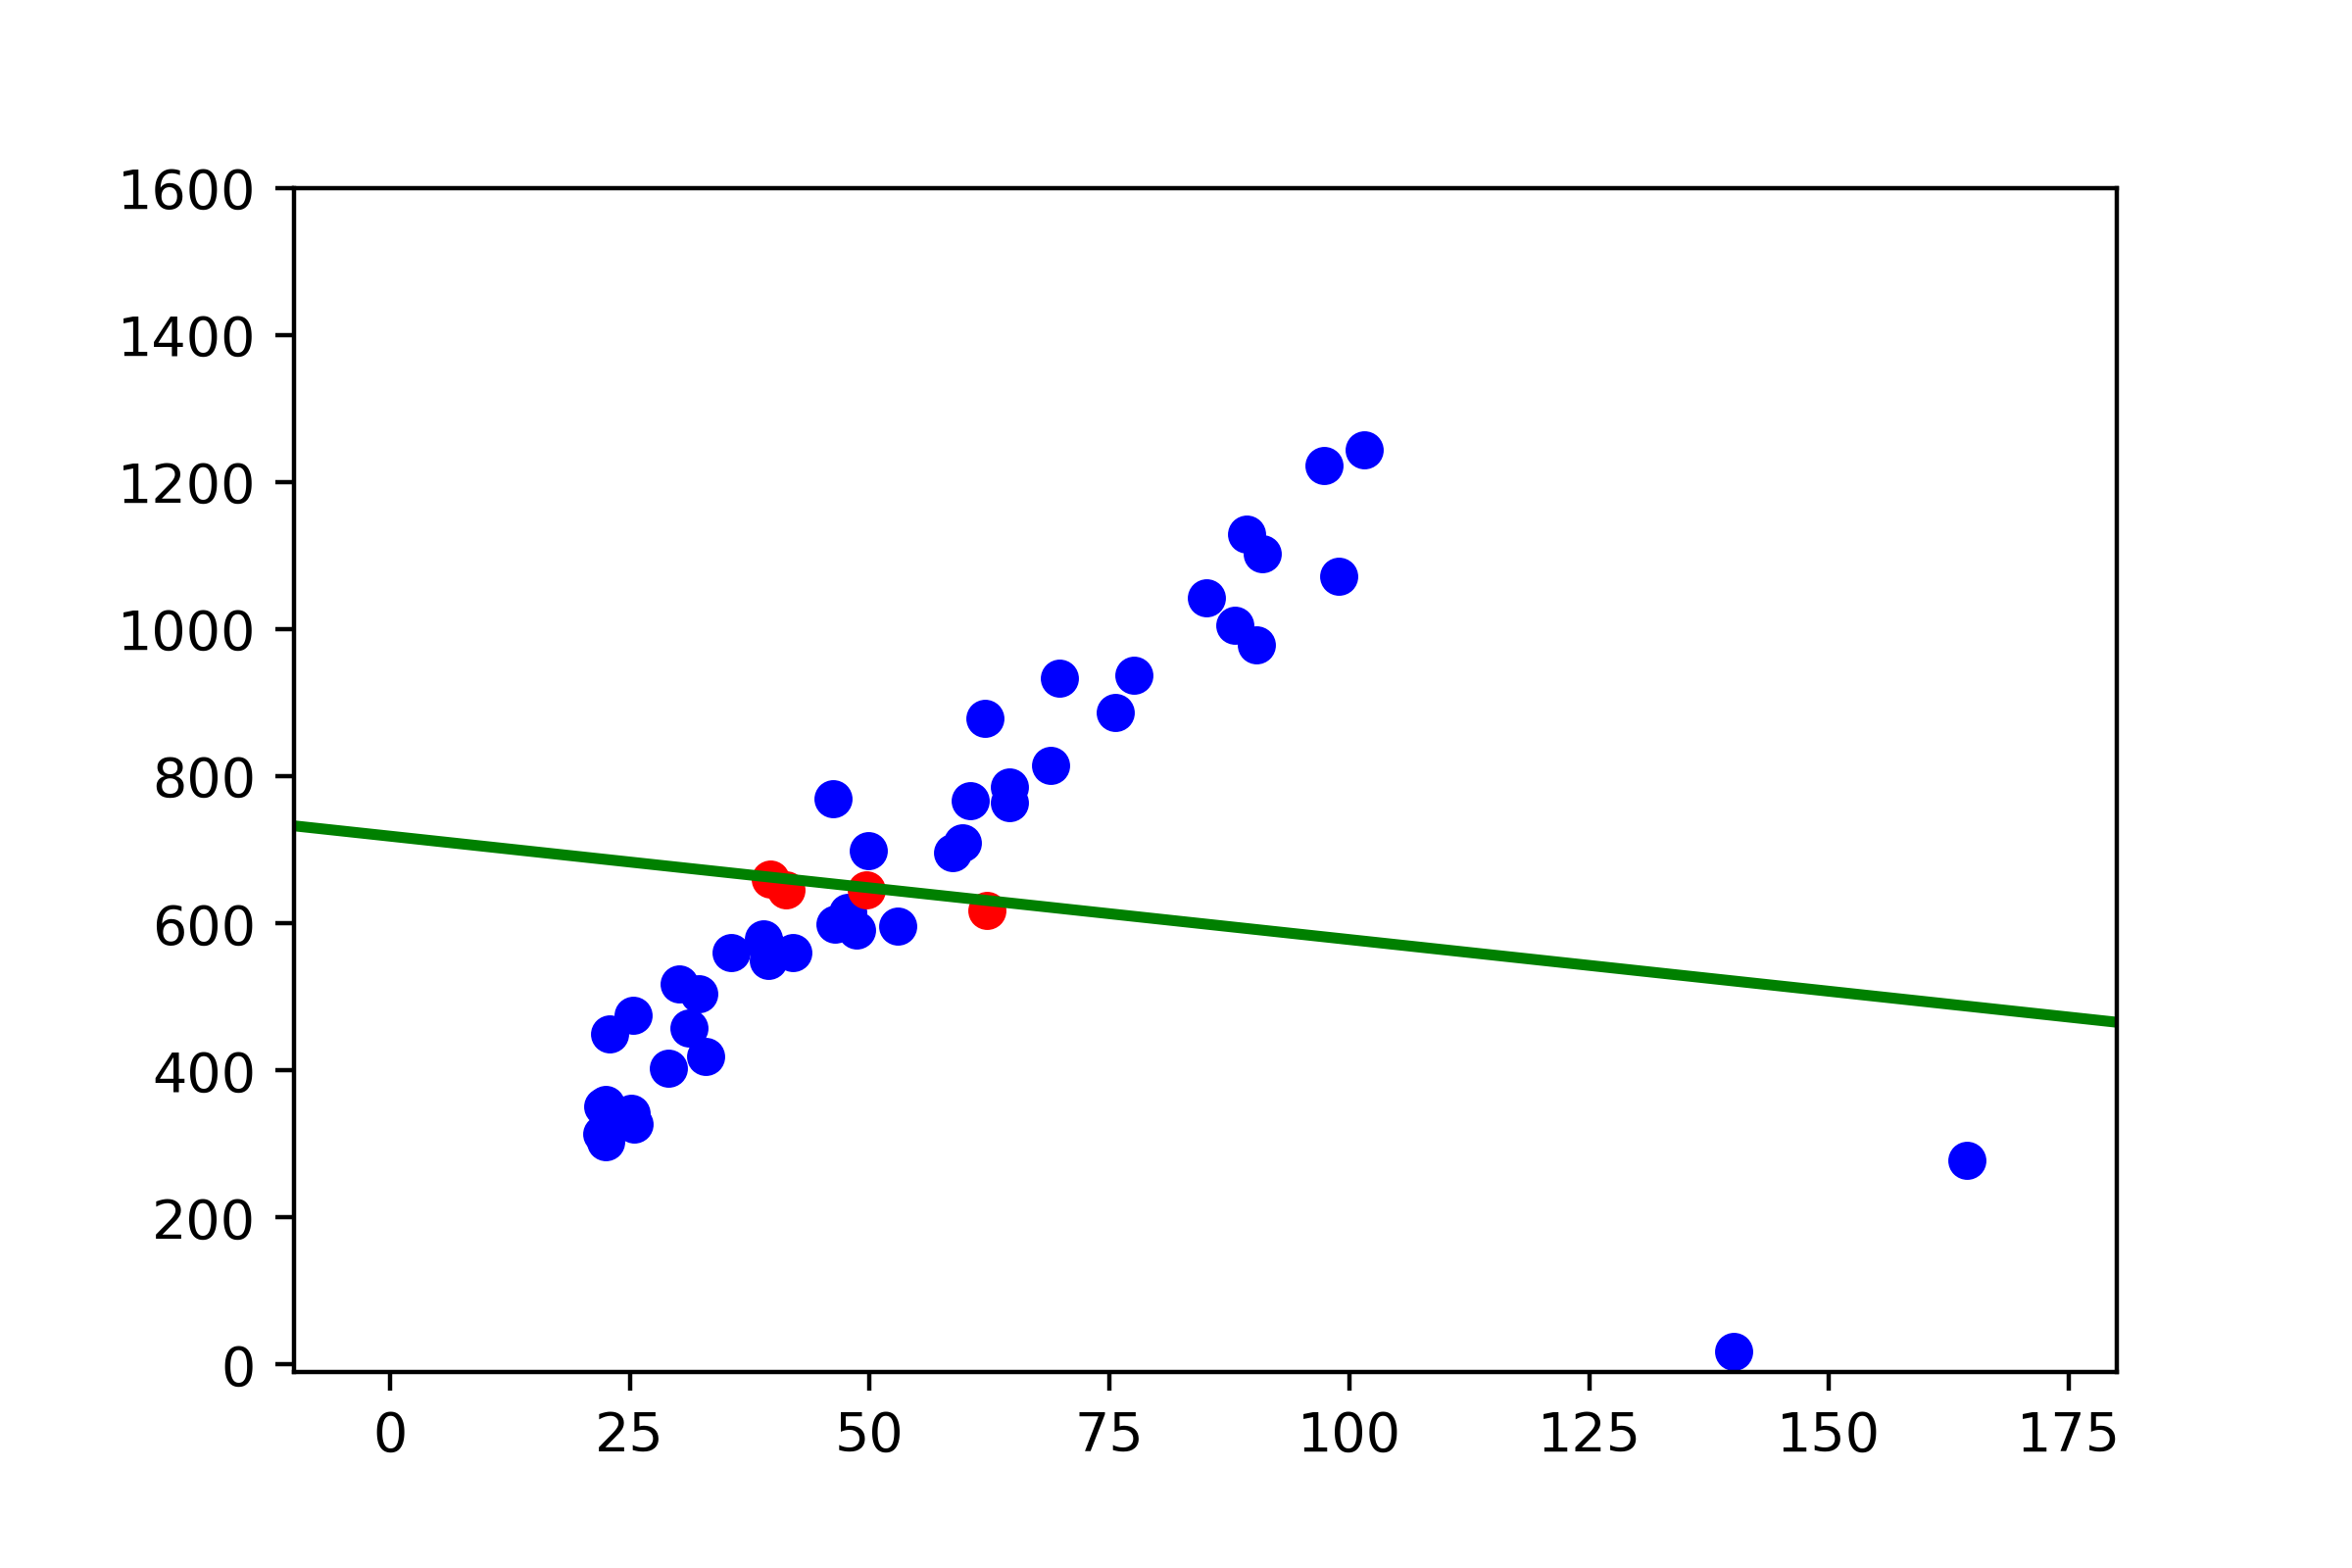
- Repeat, select two random points and do the same. Now we have two results number of outliers from the previous step and the current, so we can compare them and choose the better one.
- Repeat it from the beginning.
Looks easy, but we might have a few questions, what does it mean “close enough” and how many times we have to repeat this loop.
Tuning
Let’s start with the first question: what is close enough? For our 2D example, to measure the distance, we selected Euclidean distance. It is nothing but the shortest line’s length, which interconnects the chosen point with our model (line). When we use RANSAC, we have to set up a maximal distance threshold potential inlier can have. The absolute value has to be selected for each task individually based on the problem we are trying to solve.
The second question is how many times we have to repeat this algorithm to find a solution. We have to say that RANSAC is not necessarily giving a good solution. It is non-deterministic. We randomly select the points to build a model for our data. That means we can build a good model with some probability, depends on how data is distributed. Therefore for sets with low noise, where more points match the lineal model, we need fewer attempts to find a good parameter. Just try some values for your case.
Implementation
Here is the Python code that implements this algorithm. ransac.py
import random
import math

import numpy as np

def distance(x, y, a, b, c):
    return abs(a * x + b * y + c) / math.sqrt(a * a + b * b)


def get_coefficients(x1, y1, x2, y2):
    a = y1 - y2
    b = x2 - x1
    c = x1 * y2 - x2 * y1

    return a, b, c


def ransac(input_data, iterations=10, threshold=0.1):
    inliers = []
    outliers = []
    a, b, c = 0, 0, 0

    iteration_number = 0

    while iteration_number < iterations:
        tmp_inliers = []
        tmp_outliers = []

        data = input_data.copy()
        random.shuffle(data)

        random_point_1 = data.pop()
        random_point_2 = data.pop()

        tmp_a, tmp_b, tmp_c = get_coefficients(random_point_1[0],
                           random_point_1[1],
                           random_point_2[0],
                           random_point_2[1])

        for point in data:
            d = distance(point[0], point[1], tmp_a, tmp_b, tmp_c)

            if d < threshold:
                tmp_inliers.append(point)
            else:
                tmp_outliers.append(point)

        if len(inliers) < len(tmp_inliers):
            inliers = tmp_inliers
            outliers = tmp_outliers
            a, b, c =  tmp_a,tmp_b, tmp_c

        iteration_number += 1

    return a, b, c, inliers, outliers
For this example, I used 2-dimensional data. Nevertheless, you can apply this algorithm for high dimensional data, like 3D, 4D, etc. You will need to change helper methods, return a different model, and calculate a metric that makes sense for a particular task. If you have any questions, please drop me a message on social networks.